In this analysis, we aim to capture how long women and men wait to obtain
an eventual diagnosis. While the population-level characterization
includes all conditions and thus enables an analysis of aggregated condition codes
at scale, condition codes are sometimes a poor proxy for actual diagnosis.
Here, the presence of disease for a patient is defined by whether a patient's longitudinal
record matches a particular disease-specific set of condition criteria (i.e. a phenotype).
The conditions included in this analysis are leveraged from the publicly available OHDSI
Phenotype Library. In aggregate, the 112 diseases we selected
cover a broad range of conditions across each ICD-10-CM disease chapter except chapters
related to pregnancy, childbirth, perinatal conditions, and congenital malformations. The 112 phenotypes are further split into three categories,
each with different requirements for the number of years of continuous observation prior to diagnosis. For
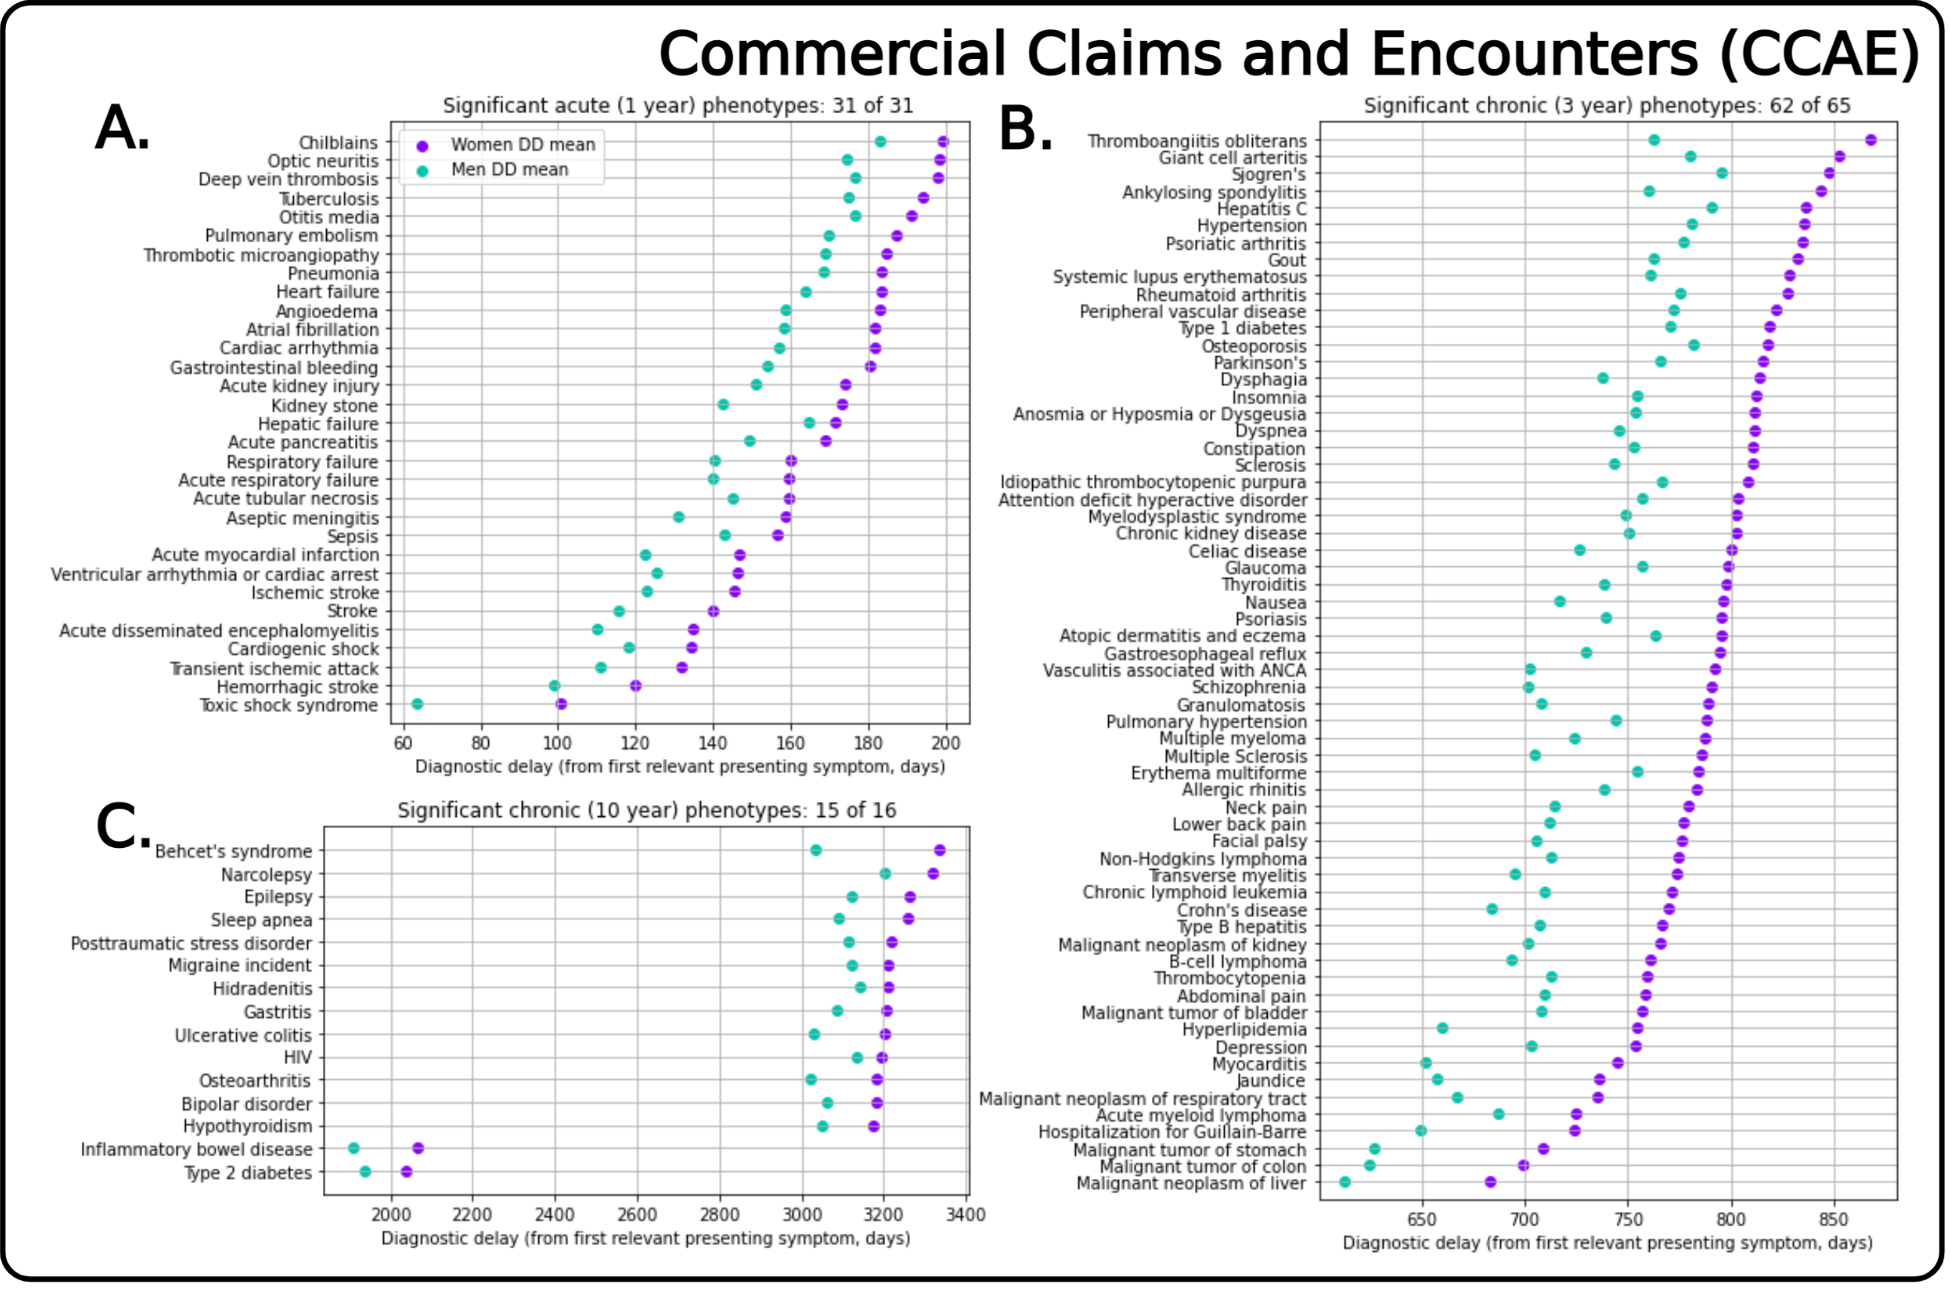
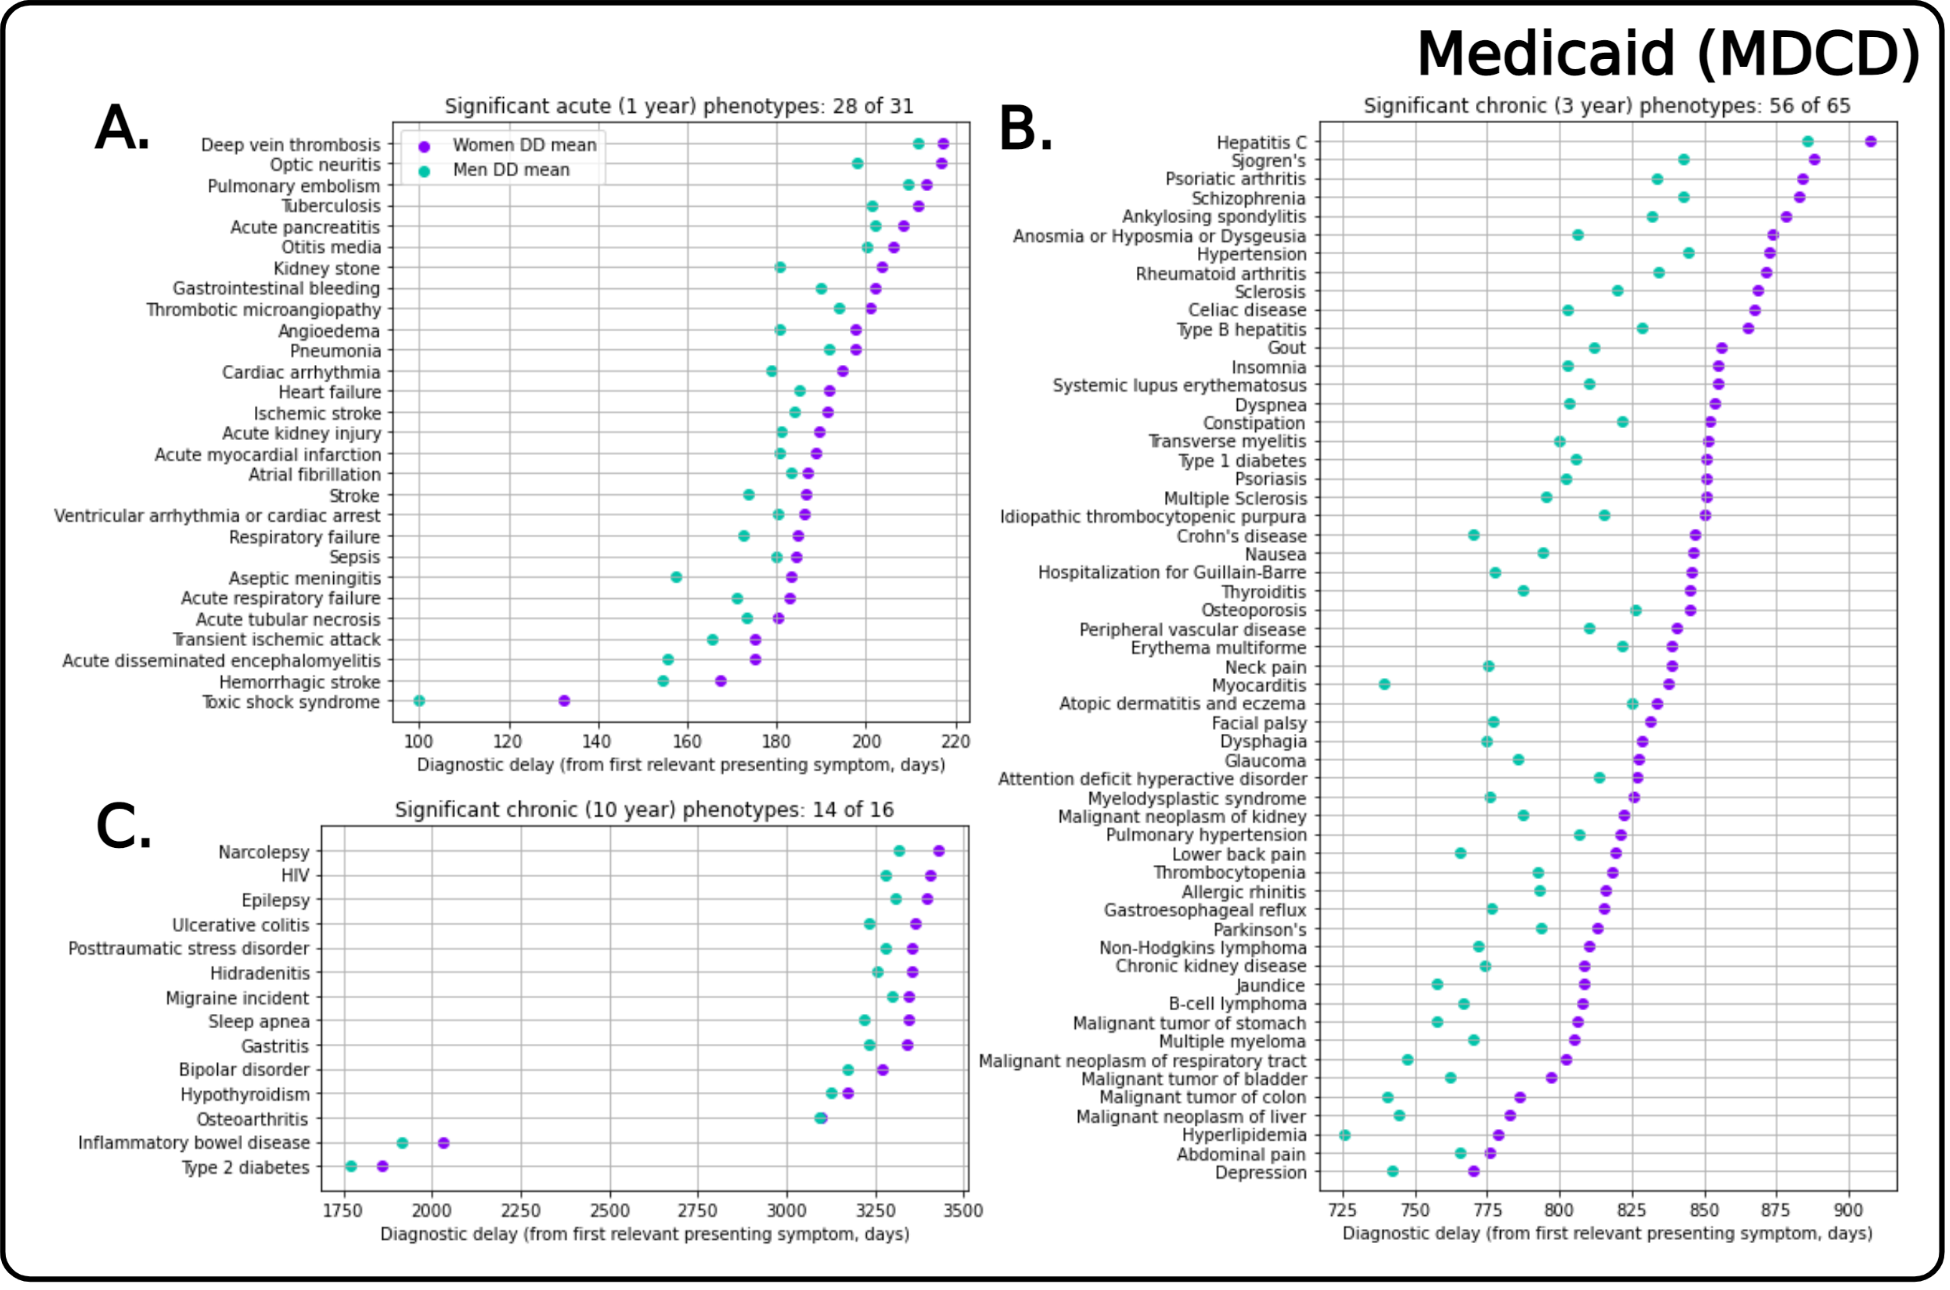
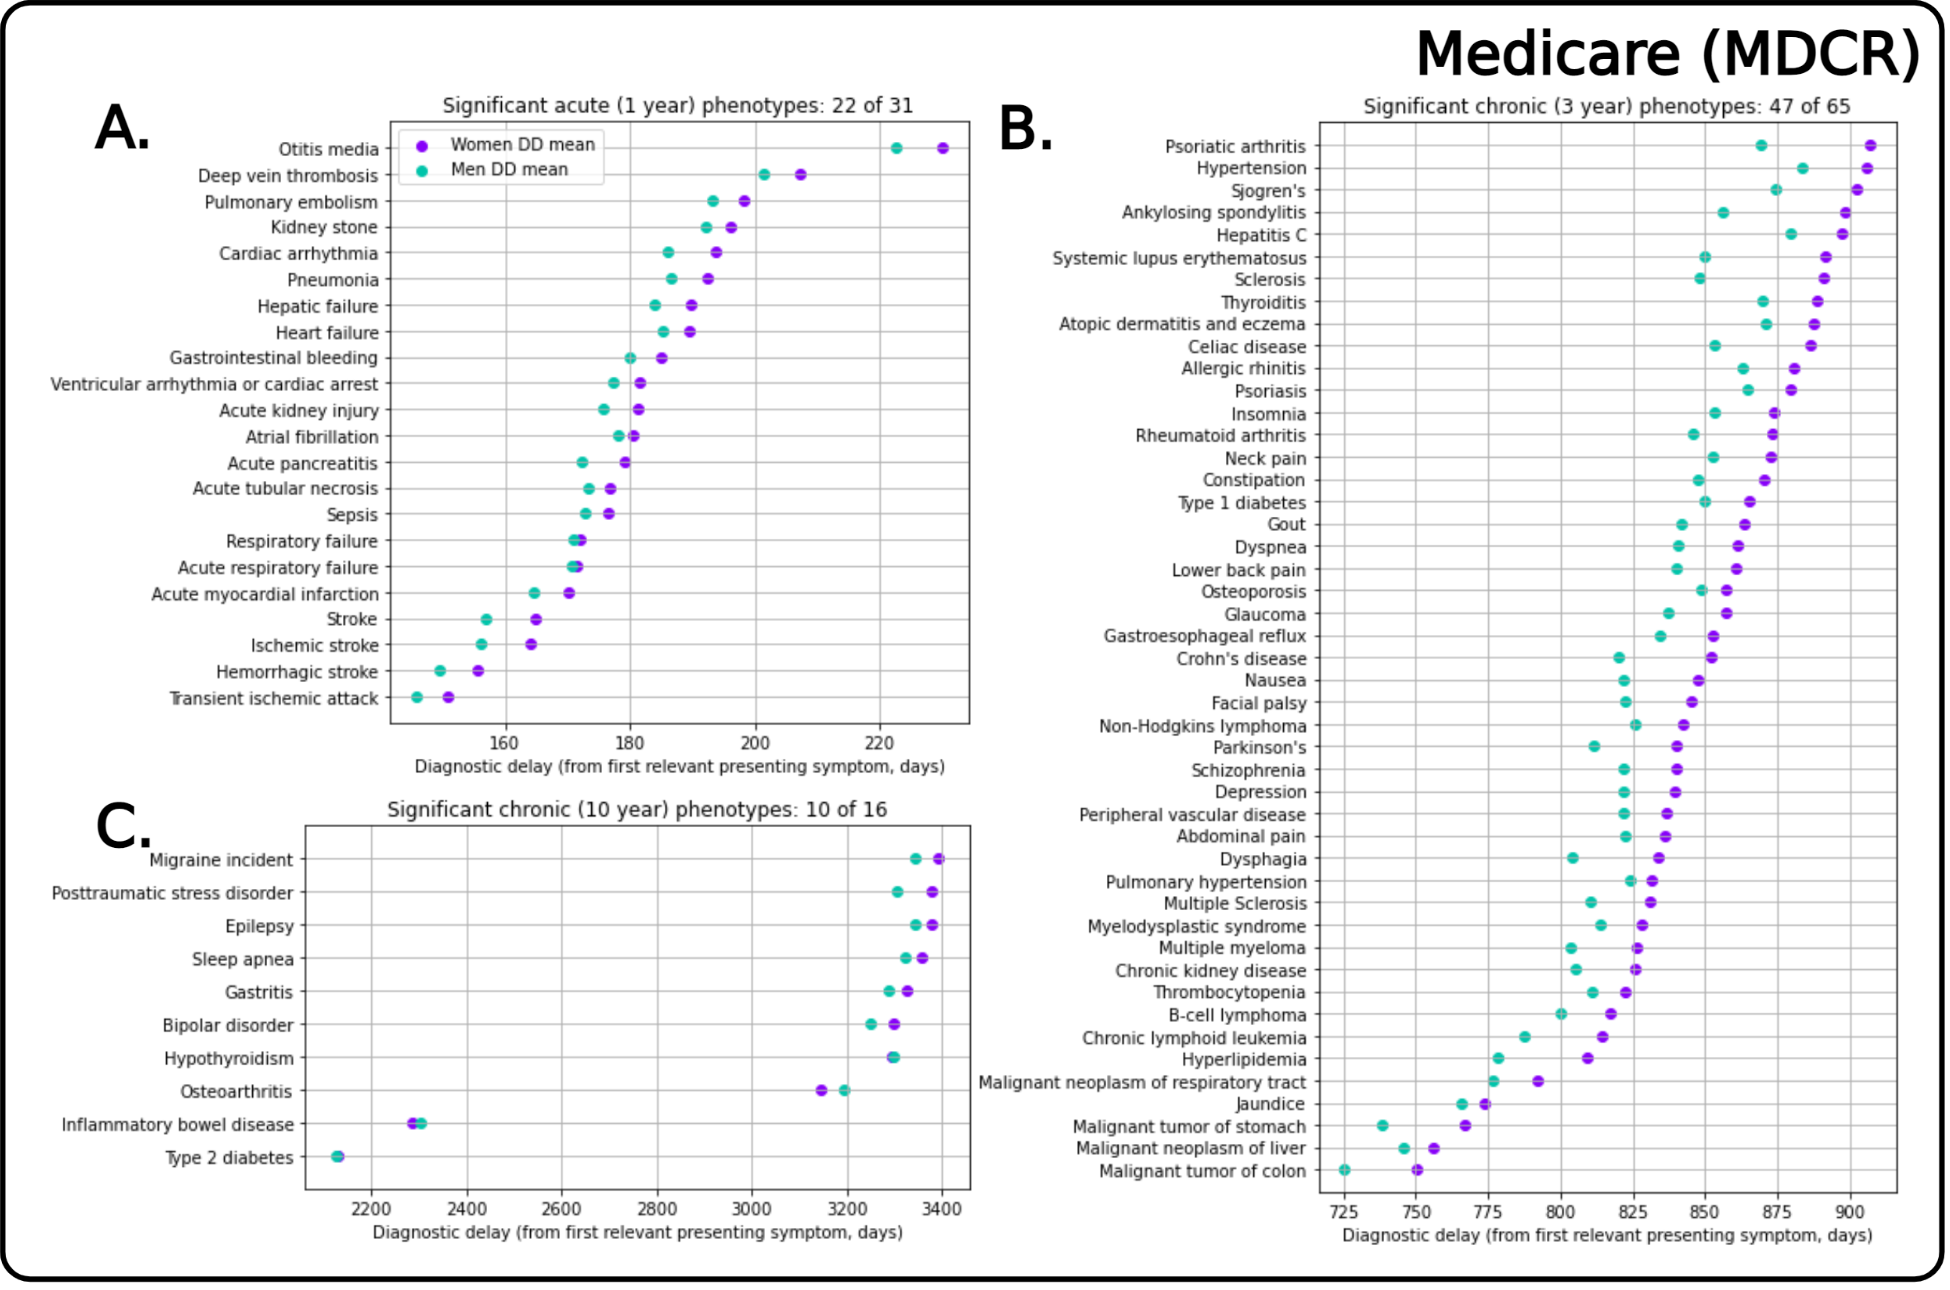
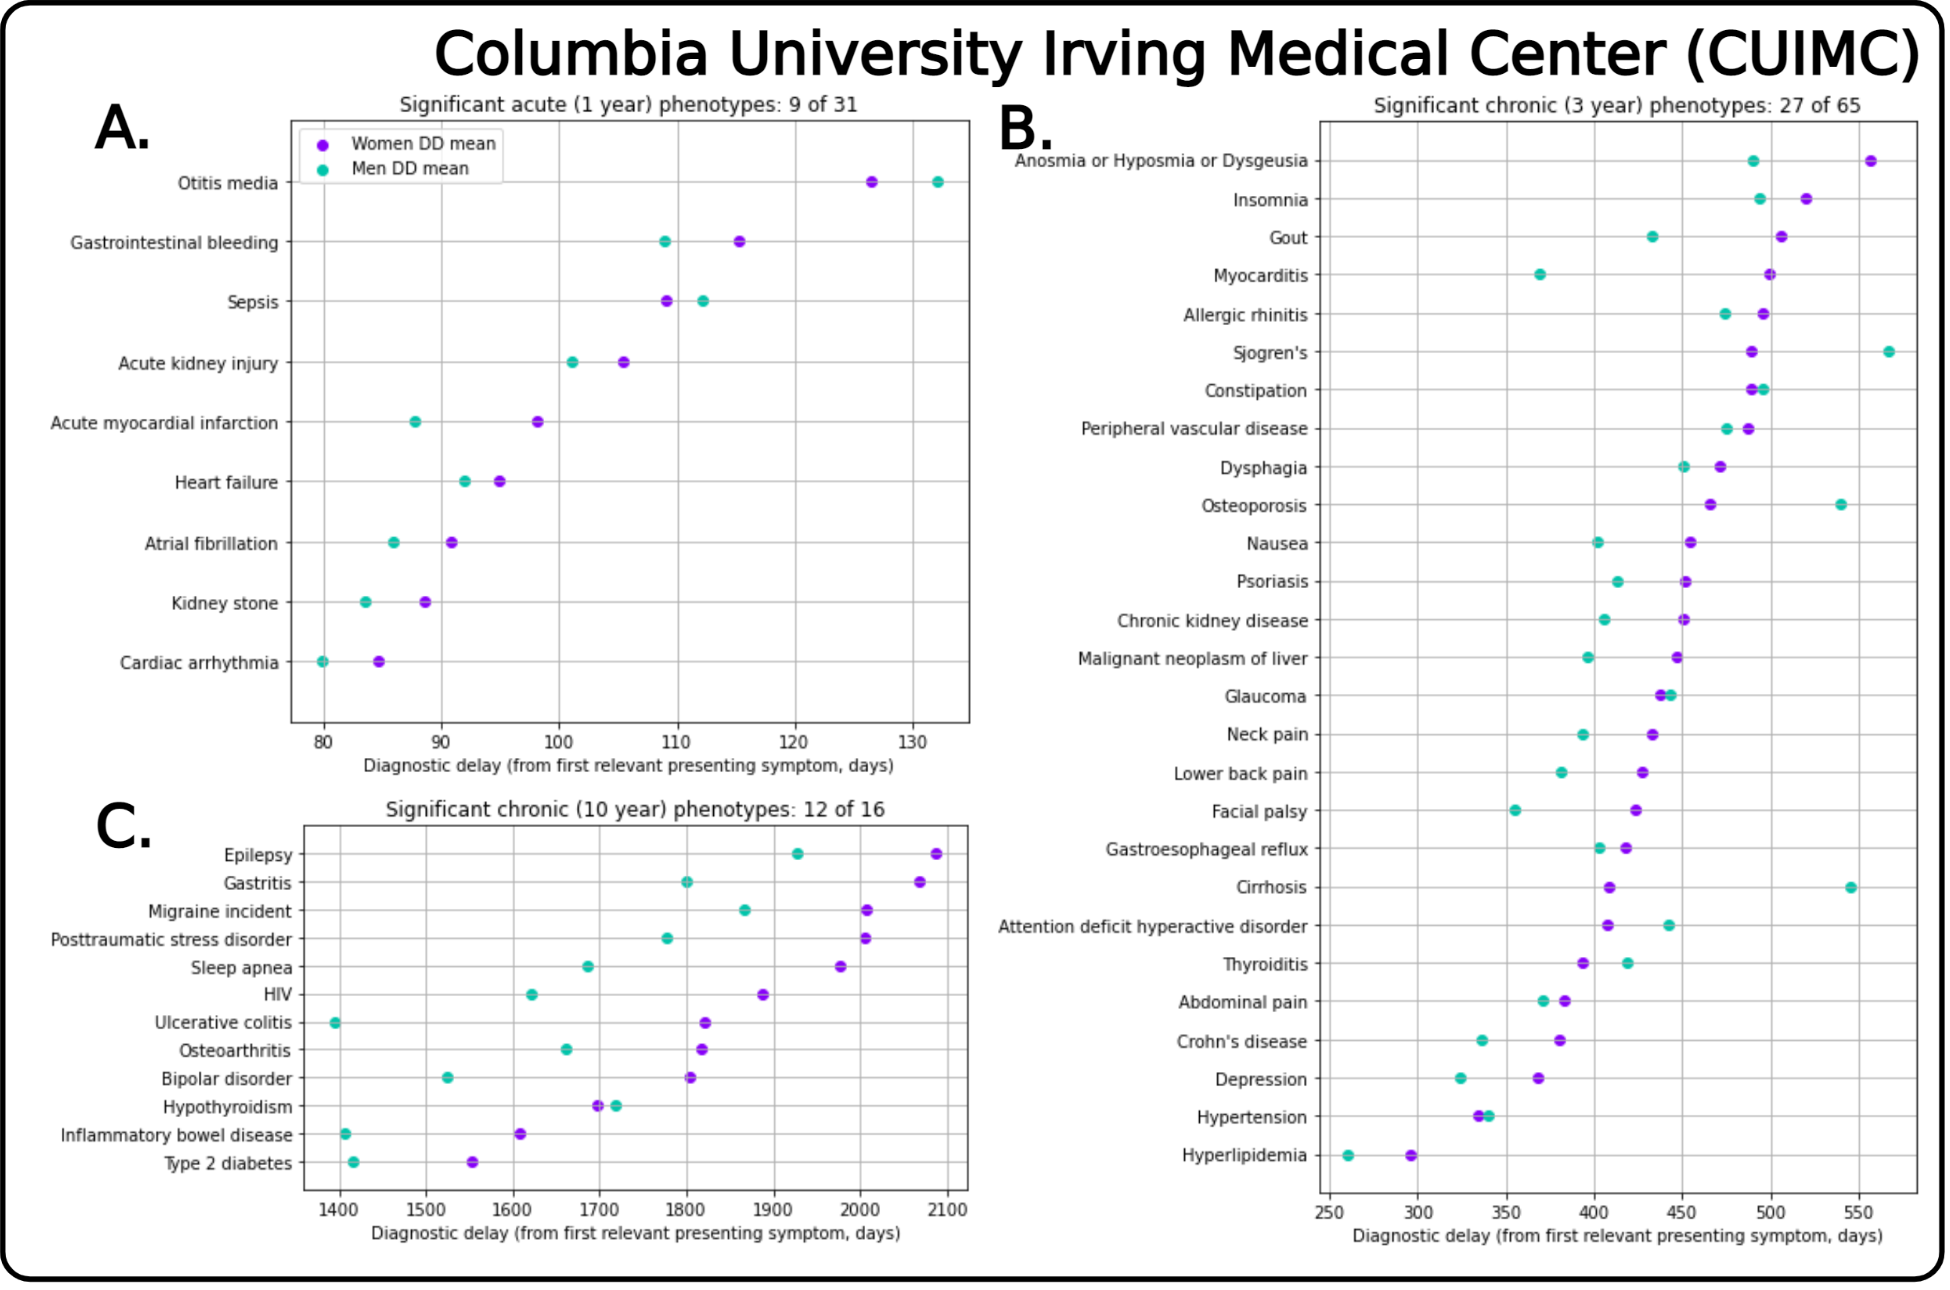
acute diseases (n=31), we review up to 1 year of prior symptoms (e.g. myocardial infarction). For mid-length
chronic diseases (n=64), we review up to 3 years of prior symptoms (e.g. chronic kidney disease). For long-term
chronic diseases (n=16), we consider up to 10 years of prior symptoms (e.g. osteoarthritis).
In order to quantify and compare time-to-diagnoses between women and men, we first consider the presenting symptoms of
a given phenotype. To identify the top 50 relevant symptoms prior to diagnosis, we use TF-IDF and upweight symptoms unique
to the phenotype (e.g. anemia for Crohn's patients) and downweight symptoms common across all phenotypes (e.g. cough). The top-50 symptoms for each
phenotype are available online in our GitHub repo for each database as CSV files with concept codes sorted by weighting:
CCAE,
MDCD,
MDCR, and
CUIMC. The file names correspond
to their cohort IDs from the mapper.
We calculate the time-to-diagnosis (TTD) for each of the top-50 presenting symptoms for a phenotype, generating
a distribution of TTDs for women and for men. We estimate the mean TTD difference between women and men as the average TTD across
the top-50 symptoms for CCAE, MDCD, MDCR, and CUIMC.
We further calculate the diagnostic delay as a patient-centric measure to represent how long women and men would individually wait
from first-presentation of any relevant symptom until diagnosis. We generate a distribution of diagnostic delays for women and for men for each
phenotype, then compare the cumulative distributions of DDs using the Kolmogorov-Smirnov (KS) test, plotting significantly different DDs.