Population-wide Characterization
In this analysis, we aim to capture patterns of diagnosis for
women and men across all conditions within the OMOP
common data model. Thus, we queried all patient conditions from
each dataset for patients with at least one year of continuous observation
between January 1, 2010 and January 1, 2020 and measured when each patient
was diagnosed with each condition. We filtered out heavily-gendered
conditions (e.g. conditions related to reproductive organs, childbirth, and
pregnancy) using the OHDSI DataQualityDashboard's list of
gendered concepts, conditions highly-prevalent in only one gender (i.e > 99% among men or women), and removing sex-specific anatomical references.
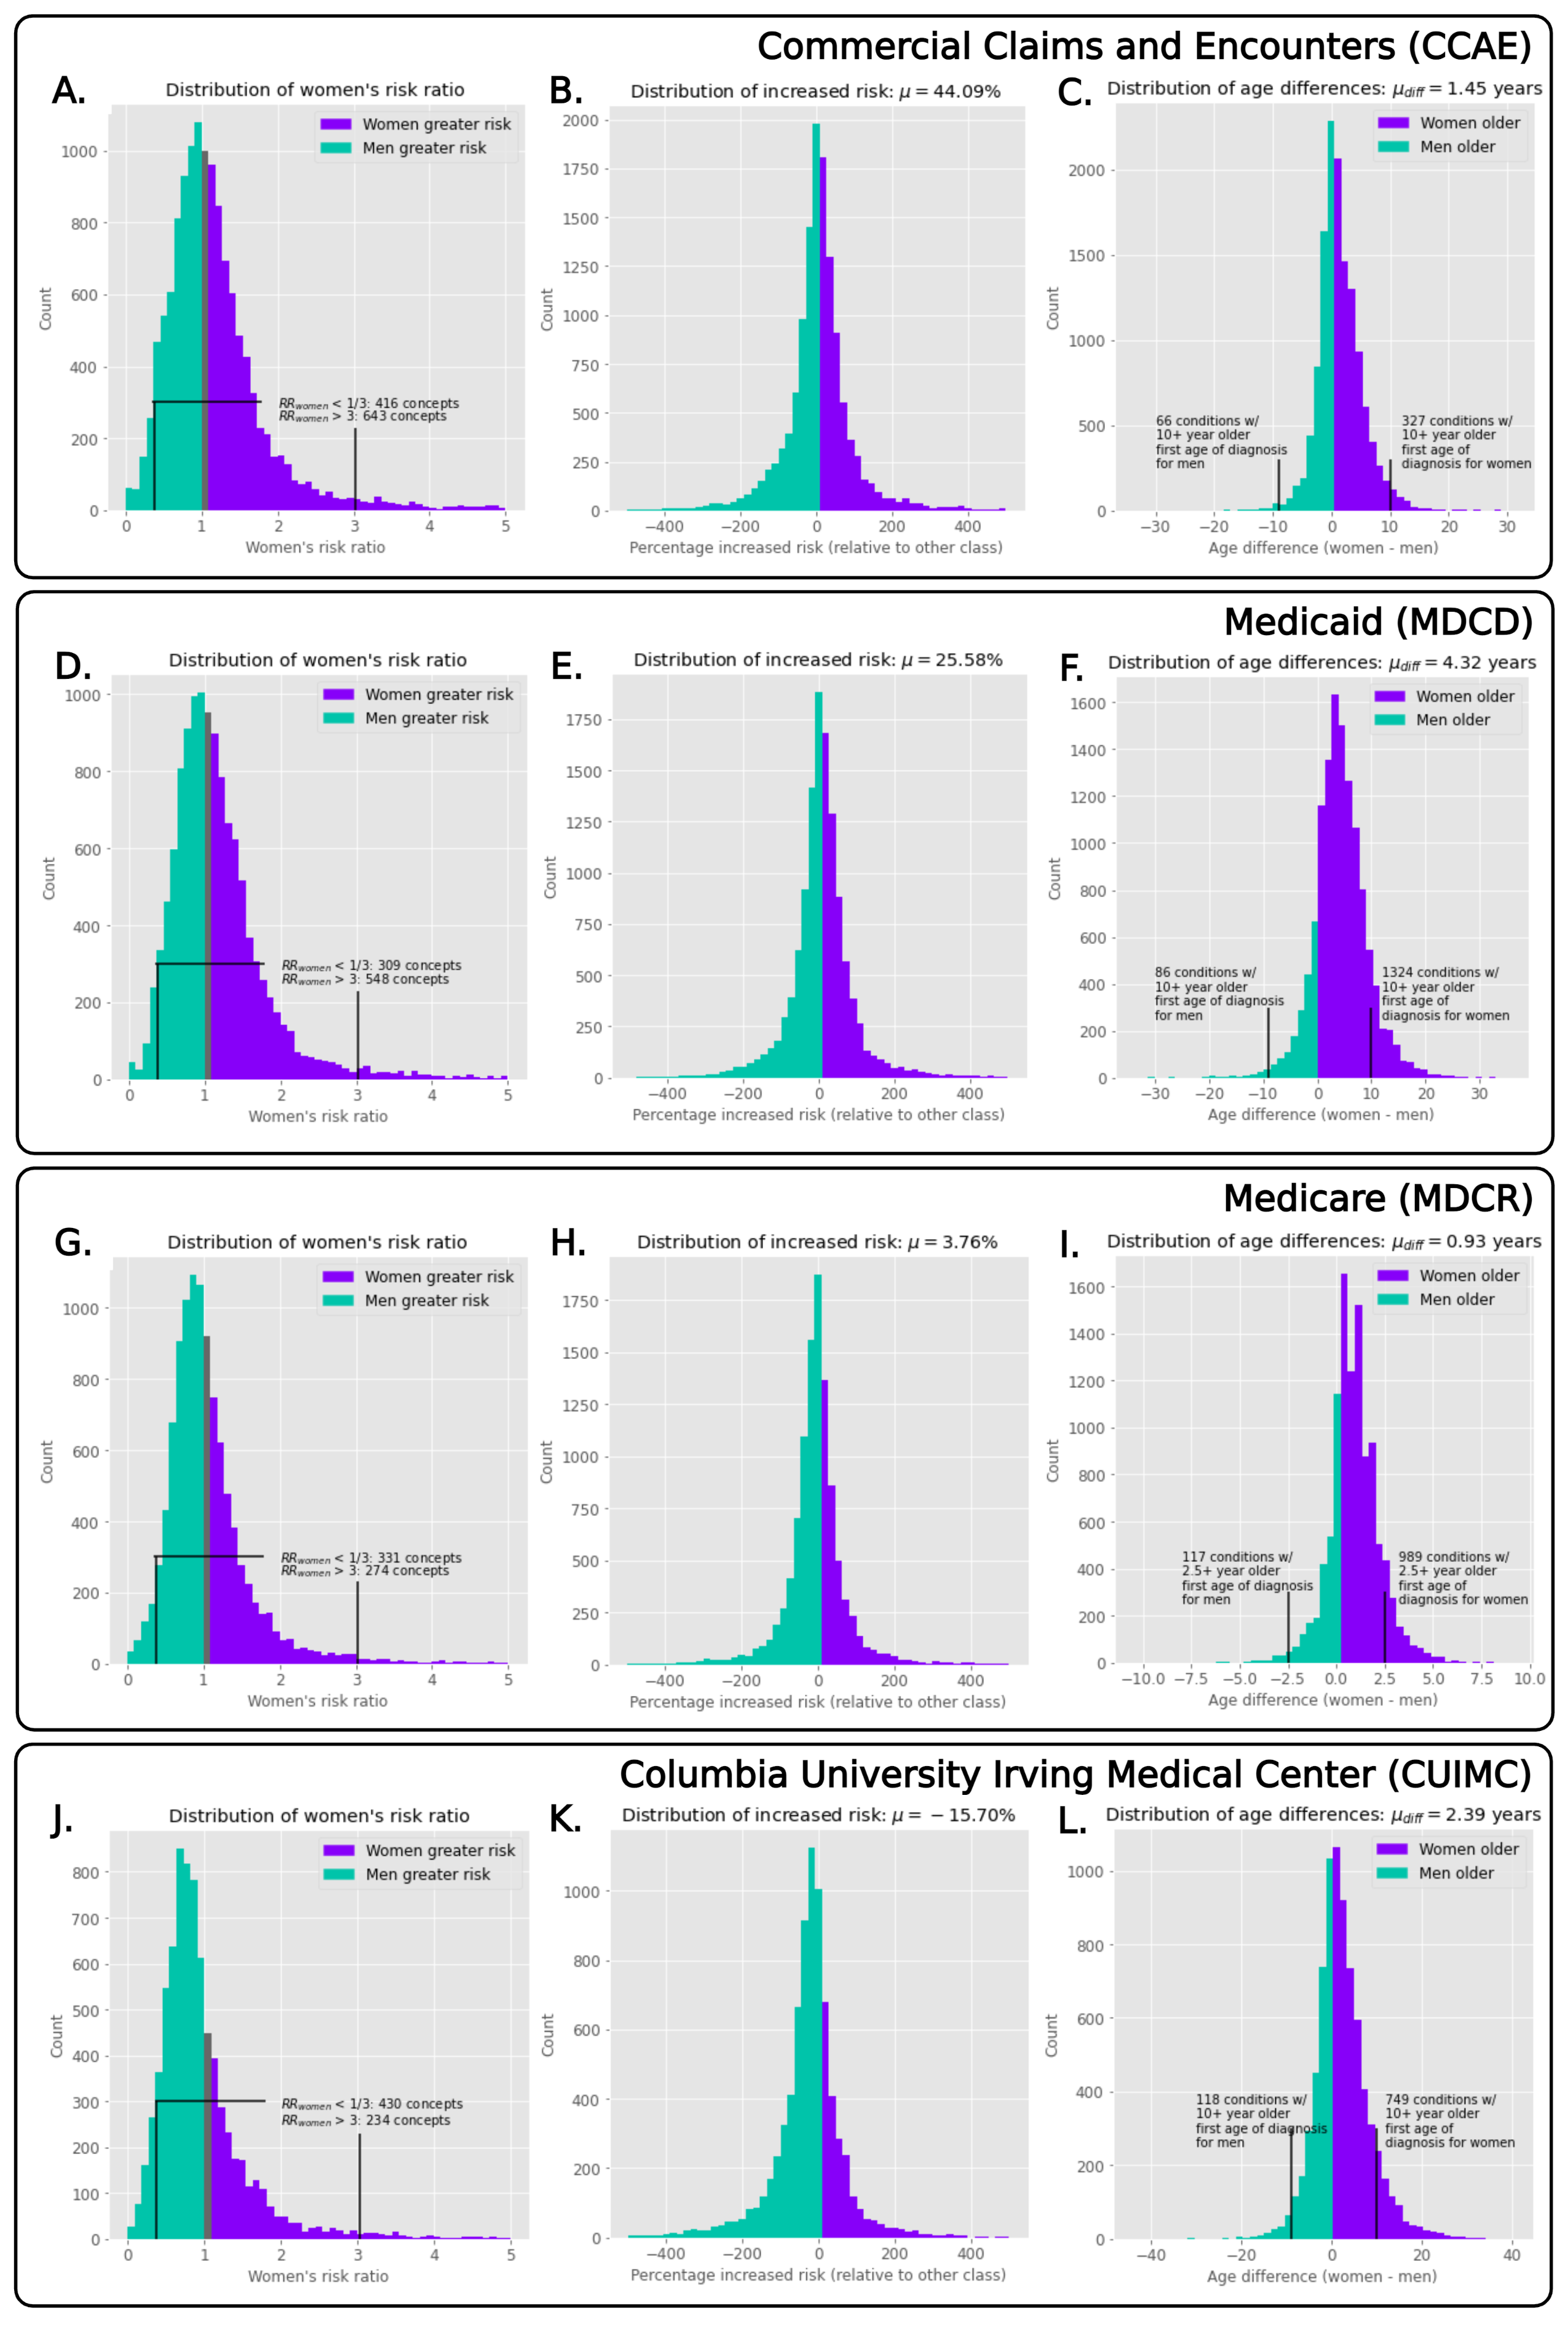
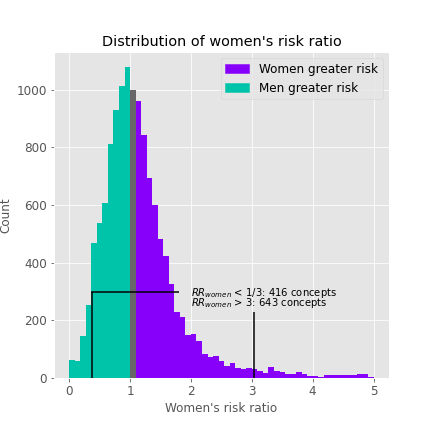
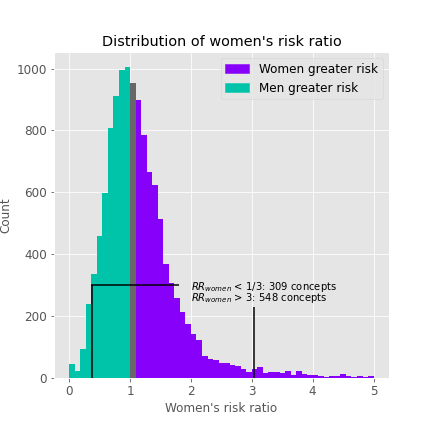
Assessment metrics: Women's risk ratio, increased risk, and first age-of-onset
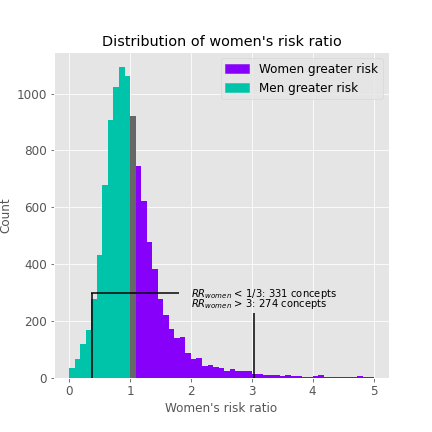
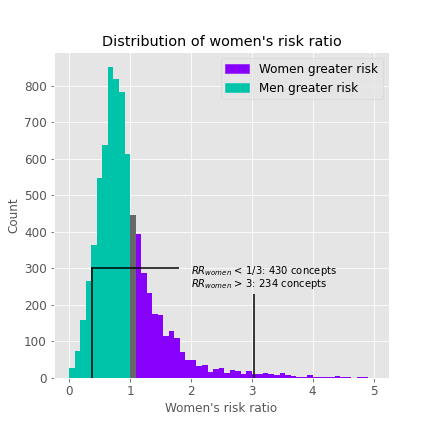
- The women's risk ratio shows how much more likely women are to be diagnosed with a particular condition than men. For example, when the women's risk ratio is greater than 1, women rae more at risk than men.
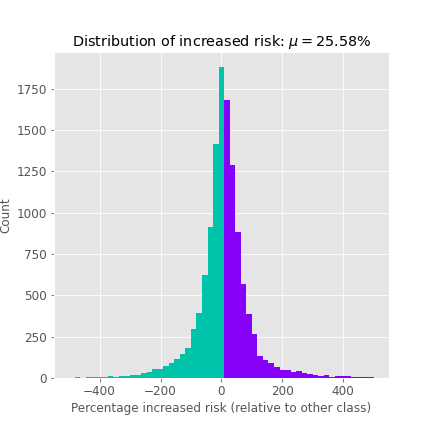
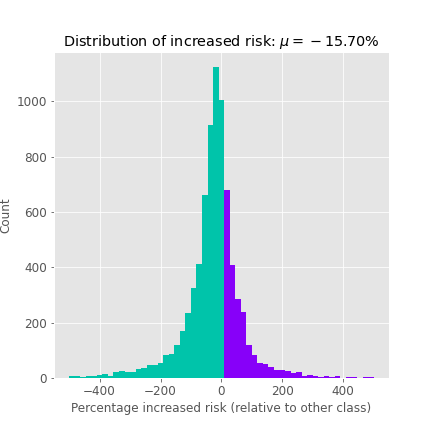
- The increased risk metric shows a normalized view of the risk ratios of the percentage more likely women or men are more likely to be diagnosed; negative values indicate more likely diagnosis among men, while positive values indicate more likely diagnosis among women.
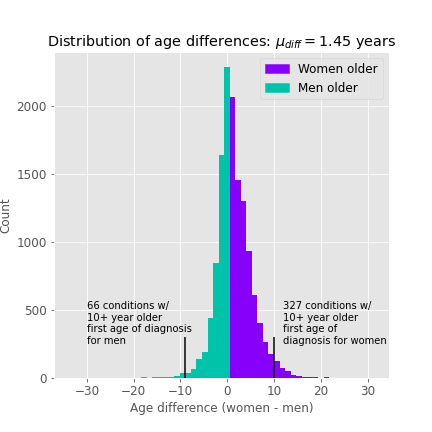
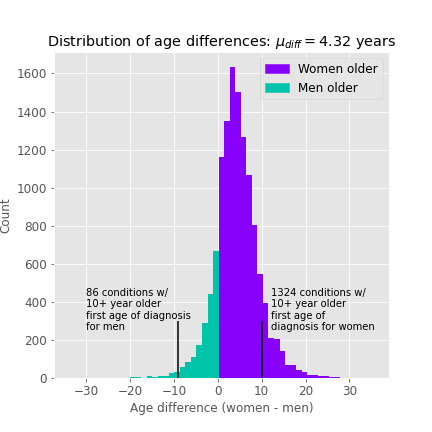
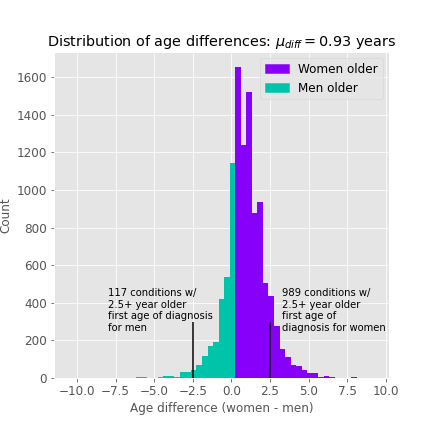
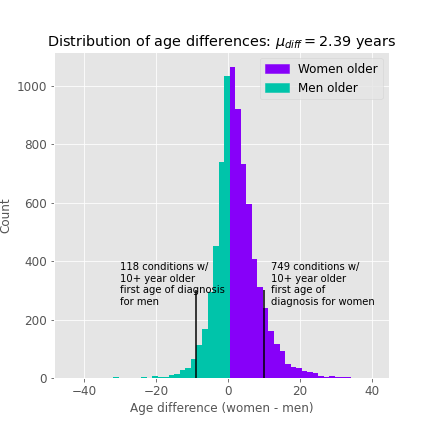
- The first age-of-onset difference shows on average differences in first age-of-onset diagnosis, with positive values indicating that women were older than men when first diagnosed.